How to Read and Use a VPD Chart Effectively
The concept of vpd sounds complicated at first, and some growers may even overlook its importance. vpd stands for Vapor Pressure Deficit, and it links humidity, temperature, and plant transpiration, which directly affects growth and yields. I won't go into the basics of vpd here, let's learn how to interpret and use a vpd chart to optimize the growing environment for healthier and more productive cannabis plants.
VPD Chart Classification
To get the most out of VPD for optimizing cannabis cultivation, growers fine-tune their growing environment with the help of VPD charts, which enable consistent results at every stage of the plant's growth. There are many VPD charts available online, so let's take a look at the different types.
Recommended Room VPD Chart
A recommended room VPD chart focuses on the overall grow room environment, emphasizing measurements of air temperature and relative humidity.
By providing optimal VPD ranges for different growth stages, these charts guide growers in adjusting environmental controls to maintain suitable conditions for plant development. This approach ensures that the general atmosphere supports healthy transpiration and nutrient uptake.
*This type of VPD chart is exemplified in the ScynceLED blog.

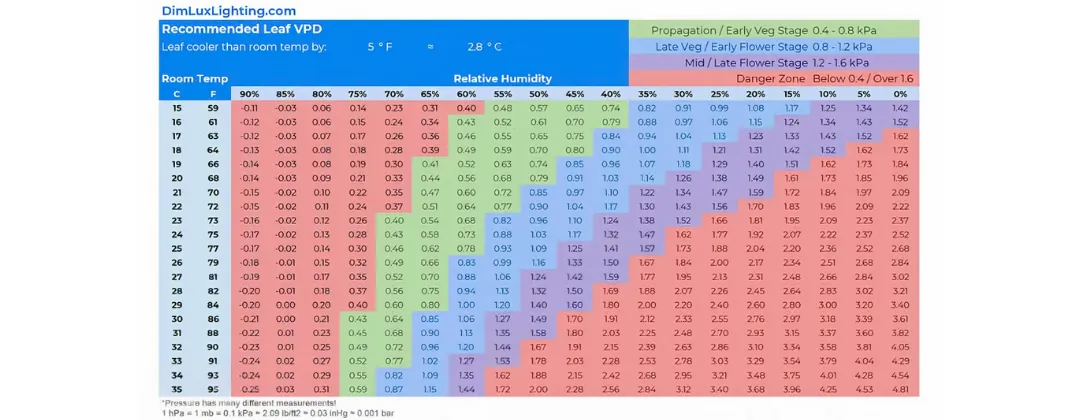
Ideal Leaf VPD Chart
Ideal leaf VPD charts concentrate on the microenvironment at the leaf surface, measuring leaf temperature to assess transpiration rates more precisely.
By accounting for the difference between leaf temperature and ambient air temperature, these charts help growers understand the plant's immediate conditions. This understanding enables more accurate adjustments to environmental factors, promoting optimal transpiration and photosynthesis.
*The Dimlux blog provides a detailed example of an ideal leaf VPD chart.
Dynamic VPD Chart
Dynamic VPD charts are interactive tools that allow growers to input real-time data—such as current temperature, humidity, and leaf temperature—to calculate the VPD instantly.
These charts provide immediate feedback, enabling cultivators to make swift adjustments to their environmental controls. This real-time adaptability is particularly beneficial in maintaining optimal growing conditions, as it accounts for fluctuations and ensures that plants remain within ideal VPD ranges throughout their development.
*You can find a practical example of a dynamic VPD chart on the VPDchart website.
There are many choices of vpd charts, but not every chart is suitable for all growers. When choosing and using a vpd chart, you must carefully consider whether the chart you choose is suitable for your growing situation, so that it can help you grow high-quality cannabis.

How to Interpret a VPD Chart
A VPD chart is an essential tool for growers to monitor and control the growing environment. By understanding how to read a VPD chart, growers can ensure that plants receive the optimal balance of temperature and humidity at each growth stage.
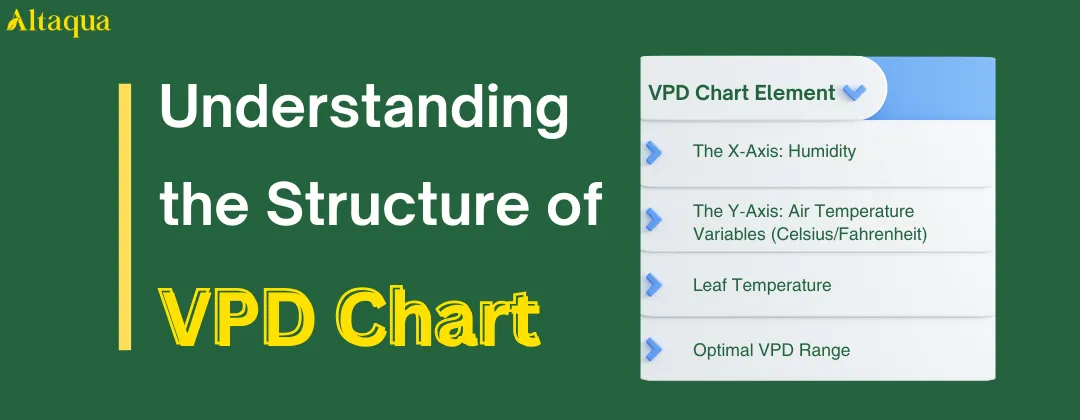
Understanding the Structure of a VPD Chart
A VPD chart visually represents the relationship between temperature, humidity, and vapor pressure deficit, helping growers determine the optimal environmental conditions for their plants. The chart is divided into axes and sometimes includes additional elements like leaf temperature, depending on its purpose.
The X-Axis: Humidity
The horizontal axis (X-axis) represents relative humidity (RH), expressed as a percentage. This data directly influences how much moisture the air can hold. A higher humidity level reduces transpiration, while lower humidity increases it.
The Y-Axis: Air Temperature Variables (Celsius/Fahrenheit)
The vertical axis (Y-axis) indicates air temperature, which can be displayed in either Celsius or Fahrenheit. Temperature affects the vapor pressure in the air and determines how quickly plants lose water through transpiration. The combination of temperature and humidity values forms the basis for calculating the VPD.
Leaf Temperature
In specialized VPD charts, such as leaf VPD charts, an additional factor leaf temperature is considered. Leaf temperature is typically lower 3° ~5° F than the surrounding air temperature due to transpiration cooling. This element provides a more precise understanding of the plant’s microenvironment. Including leaf temperature in VPD calculations allows growers to assess the plant’s transpiration rate and adjust environmental controls with greater accuracy.
By understanding these structural elements, growers can better interpret a VPD chart and apply the data to create optimal growing conditions tailored to their plants' specific needs.
Identifying Ideal VPD Ranges for Different Growth Phases
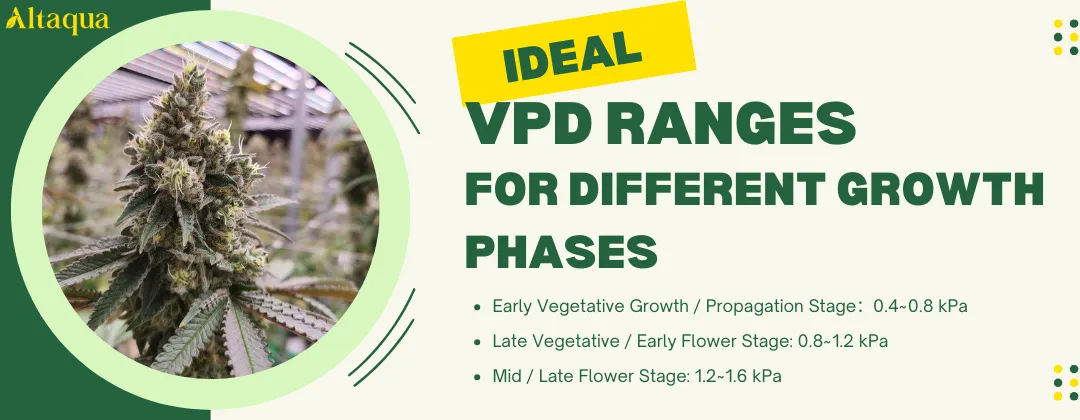
The VPD chart provides a reference for different growth phases of cannabis, with each colored region corresponding to an ideal VPD range and reflecting the plant's growth status and needs within that range.
Early Vegetative Growth / Propagation Stage
In the chart, the dark green area indicates the optimal VPD range for cannabis in the Early Vegetative Growth or Propagation Stage.
Plants at this stage are still relatively young and include seed germination, seedling development and root growth of clonal plants. The higher humidity and moderate temperature of the environment at this time can effectively reduce the intensity of transpiration and prevent the plant from losing too much water, while promoting the formation and expansion of the root system.
- Optimal VPD range: 0.4 to 0.8 kPa
- Growth characteristics within the dark green zone:
In this range, plant transpiration is low, water demand and supply are in balance, and seedlings are able to focus on root development, thus laying a good foundation for subsequent growth stages.
Late Vegetative / Early Flower Stage
The light green areas in the chart represent the optimal VPD range for the Late Vegetative and Early Flowering stages of cannabis.
This stage is a critical time in the plant's transition from rapid nutrient growth to flowering, as the plant's leaves and stem continue to develop while beginning to reserve energy for flower formation. Transpiration gradually increases, promoting efficient transport of nutrients and water. Moderate humidity and slightly higher temperatures maintain a healthy transpiration rate and support steady plant growth.
- Optimal VPD range: 0.8 to 1.2 kPa
- Growth is characterized within the light green zone:
Plants exhibit healthy transpiration rates in this range, and their rapid leaf growth and thickening stems help support the upcoming flowering stage.
Mid / Late Flower Stage
The yellow areas in the chart indicate the optimal VPD range for marijuana in the mid and late flowering stages.
This is a period of concentrated flower development where humidity demands are reduced and transpiration peaks to promote floral nutrient transport and metabolic activity. At the same time, the lower humidity environment reduces the risk of mold and disease, ensuring flower quality and yield.
- Optimal VPD range: 1.2 to 1.6 kPa
- Growth characteristics in the yellow zone:
In this range, the plant exhibits a high transpiration rate, which promotes flower density and weight gain.
By identifying the color zones in the chart, cannabis growers can precisely regulate environmental conditions to provide the ideal VPD range for each growth stage, thereby maximizing the growth potential and yield quality of the plants.
Exploring Danger Zones of the VPD Chart to Prevent Cannabis Diseases
The Vapor Pressure Deficit (VPD) chart is a vital tool for maintaining the delicate balance of environmental factors in cannabis cultivation. While the optimal VPD range supports healthy growth, deviations into the extreme zones can have detrimental effects.
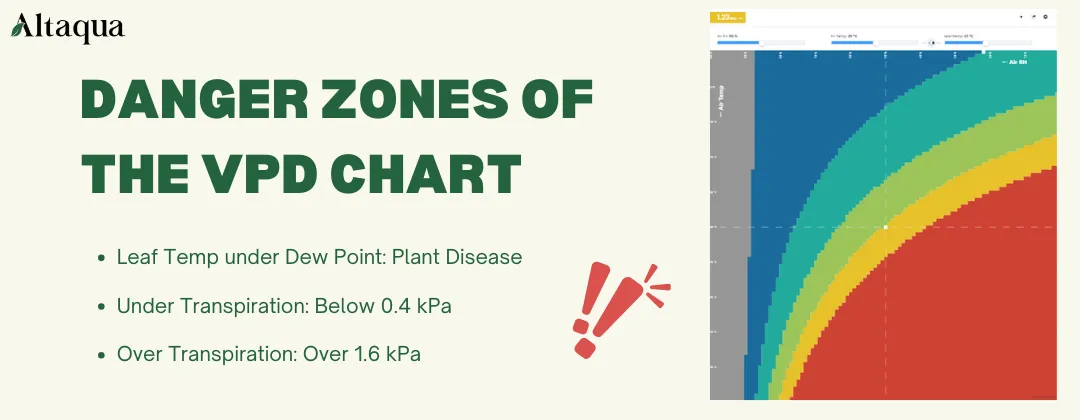
Gray Zones: Plant Disease
The gray zone on the VPD chart occurs when the leaf temperature drops below the dew point of the surrounding air. In this situation, condensation forms on the leaf surface, creating an ideal breeding ground for fungal pathogens such as powdery mildew and botrytis (gray mold).
Excess moisture disrupts the natural balance of the plant's environment, blocking stomata and inhibiting essential gas exchange. This not only hinders transpiration but also limits photosynthesis, reducing energy production and overall plant health. Prolonged exposure to condensation can lead to tissue damage, increasing the risk of rot and other diseases, especially in dense canopies where airflow is limited.
Blue Zones: Under Transpiration
The blue zone represents VPD levels under 0.4 kPa, a condition characterized by excessively high relative humidity and insufficient transpiration. In this environment, the stomata on the leaves partially close, reducing the plant’s ability to transpire water. Without adequate transpiration, nutrient uptake through the roots is impaired, leading to deficiencies and slowed growth.
Moreover, the reduced water movement within the plant impacts its ability to cool itself, potentially causing overheating. High humidity also increases the risk of fungal infections, as the plant's surface remains damp for extended periods.
Red Zones: Over Transpiration
The red zone occurs when the VPD exceeds 1.6 kPa, a state of extreme dryness where the air draws excessive moisture from the plant. This over-transpiration stresses the plant as it struggles to keep up with water loss. Leaves may wilt, curl, or develop scorch marks due to dehydration, reducing their photosynthetic capacity and overall vigor.
In this condition, the plant redirects energy toward survival, sacrificing growth and bud production. Prolonged exposure to high VPD levels can result in permanent damage.
Case Studies of Using a VPD Chart in Cannabis Cultivation
Different types of VPD charts, such as static, dynamic, and customized, offer varying levels of precision to suit different growing setups. In this section, we will provide specific examples of how each chart type can be applied.
Utilizing a Static VPD Chart in Cannabis Cultivation
A static VPD chart provides a pre-determined guide that connects air temperature, relative humidity, and their resulting VPD. For this case, we will reference the Dimlux blog’s VPD chart, which is widely used for cannabis cultivation.
Example Scenario (Flowering Stage):
- Air temperature: 25°C (77°F)
- Relative humidity (RH): 50%
- Leaf temperature: 23°C (73°F)
Using the static VPD chart from the Dimlux blog:
- At 25°C air temperature and 50% RH, the chart shows a VPD of approximately 1.47 kPa.
- This value falls within the optimal range for the mid flower stage, which is generally 1.2–1.6 kPa according to the Dimlux reference.
In this range, plants transpire effectively, absorbing nutrients without excessive water loss or stress. Maintaining these conditions minimizes the risk of mold while promoting robust bud development.
Leveraging a Dynamic VPD Chart for Precision Control
Dynamic VPD charts are designed to provide real-time adjustments based on live data, allowing growers to fine-tune environmental variables with precision. For this example, we will reference the vpdchart.com tool, which calculates VPD values dynamically based on inputs like air temperature, RH, and leaf temperature.
Example Scenario (Flowering Stage):
- Air temperature: 28°C (82.4°F)
- Relative humidity (RH): 50%
- Leaf temperature: 26°C (78.8°F)
Using the dynamic VPD chart on vpdchart.com:
- Inputting these values into the tool yields a VPD of approximately 1.47 kPa, which is at the upper limit of the optimal range for the flowering stage.
- A higher VPD like this can indicate increased transpiration, which, if left unchecked, could lead to water stress and nutrient imbalances.
A Customized VPD Chart for Specific Cultivation Needs
The PulseGrow VPD chart is a customized tool designed to help cannabis growers maintain optimal environmental conditions during every stage of plant growth.
Example Scenario (Flowering Stage):
Settings on the Chart:
- Growth stage: Flowering
- Leaf temperature adjustment: -1°C
- Units: Celsius
Environmental Conditions:
- Air temperature: 27°
- Relative humidity: 55%
From the PulseGrow VPD chart:
At 27°C air temperature and 55% RH, with a -1°C leaf temperature adjustment, the calculated VPD is approximately 1.3 kPa. This value is within the optimal range for the flowering stage (typically 1.2–1.6 kPa), ensuring enhanced resin and bud production while minimizing the risk of mold.
The flexibility of PulseGrow's VPD chart allows growers to adapt to specific cultivation requirements. By regularly monitoring and adjusting environmental factors, growers can maximize the potential of their cannabis plants while minimizing risks.
Challenges of Using a VPD Chart in Commercial Cannabis Grow Rooms
While VPD charts are a powerful tool for optimizing environmental conditions in cannabis cultivation, their application in commercial grow rooms often presents several challenges.
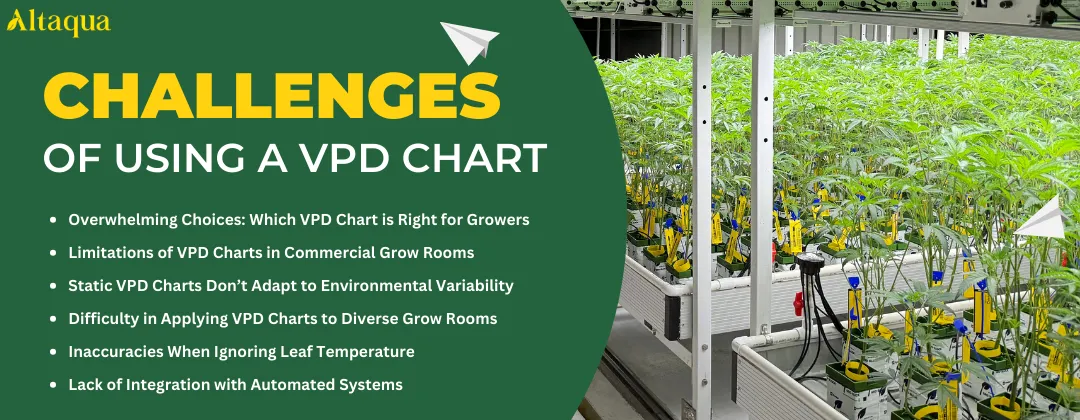
Overwhelming Choices: Which VPD Chart is Right for Growers?
Growers often encounter a vast array of VPD charts tailored to different plant stages, environmental setups, and temperature metrics. Some charts are static and require manual adjustments, while others are more dynamic and customizable, such as those provided by vpdchart and PulseGrow.
The issue arises when growers lack clear guidance on which chart aligns with their specific goals. Choosing an incorrect chart—or failing to adapt it to a facility's unique requirements—can lead to ineffective environmental management, ultimately impacting plant health and yield. To mitigate this, growers must identify tools that match their operational scale and plant growth stages while considering features like leaf temperature adjustments and real-time monitoring.
Limitations of VPD Charts in Commercial Grow Rooms
VPD charts are widely used to optimize environmental conditions in cannabis grow rooms. However, their application in large-scale commercial facilities can present unique challenges. These challenges stem from the complexity of managing diverse strains, dynamic environmental conditions, and integrating modern automation systems. Below, we explore the most common difficulties faced by growers.
Static VPD Charts Don’t Adapt to Environmental Variability
Commercial grow rooms often face microclimatic variations caused by factors such as airflow distribution, lighting intensity, and equipment placement. Static VPD charts fail to reflect these localized differences, resulting in suboptimal conditions for some plants.
Difficulty in Applying VPD Charts to Diverse Grow Rooms
Commercial facilities frequently cultivate multiple strains with distinct environmental needs. Managing these differences within a single grow room can be challenging, as no universal VPD chart can cater to all strain-specific requirements.
Inaccuracies When Ignoring Leaf Temperature
Many growers neglect the influence of leaf temperature, which is typically lower than air temperature due to transpiration. Ignoring this factor can lead to inaccurate VPD readings, potentially causing over- or under-transpiration in plants.
Lack of Integration with Automated Systems
Automation systems are essential in large-scale facilities, yet most VPD charts are not designed for seamless integration. This limitation requires manual intervention to adjust equipment, reducing efficiency and increasing labor costs.
The Impact of Using Incorrect VPD Charts on Different Cannabis Growth Stages and Recovery Strategies
In the earlier sections of this blog, we discussed the optimal VPD ranges for different cannabis growth stages based on the VPD chart. However, when VPD values deviate from these ideal ranges, significant challenges can arise at each stage of development. These deviations can negatively affect plant health, slow growth, and reduce yields.
Early Vegetative/Reproductive Stages
Incorrect VPD values in the early stages of cannabis growth can lead to stunted growth and an increased risk of disease, jeopardizing the success of the entire crop.
Common Problems in Early Vegetative Growth Caused by Incorrect VPD
During the early vegetative or propagation stage, young plants are particularly sensitive to environmental conditions. If the VPD is too high (e.g., above 0.8 kPa), seedlings may transpire excessively, losing water faster than they can absorb it through their underdeveloped root systems. This can lead to dehydration, wilting, and slowed root development.
Conversely, a VPD below the optimal range (e.g., under 0.4 kPa) creates overly humid conditions that can suppress transpiration. This leads to poor gas exchange and increases the risk of damping-off disease, where excessive moisture around the stem causes fungal infections.
Adjusting Environmental Conditions for Recovery
To address these issues, growers can gradually adjust humidity and temperature to bring the VPD back into the optimal range of 0.4 to 0.8 kPa for this stage. Lowering air temperature or increasing relative humidity can reduce excessive transpiration, while improving air circulation helps prevent overly damp conditions. Root system health should also be closely monitored, and a light, balanced nutrient solution can support recovery.
Late Vegetative/Early Flowering Stages
The late vegetative and early flowering stages represent a transition from active plant growth to the development of flower buds. During this period, an inappropriate VPD can disrupt this transition, delay flowering and have a negative impact on overall yield potential.
Impact on Plant Transition from Vegetative to Flowering
During the transition from late vegetative to early flowering stages, plants require a balanced environment to support both vegetative growth and the initiation of flowering. An incorrect VPD in this phase can significantly disrupt this balance. A high VPD (e.g., above 1.2 kPa) can overstress the plant by forcing excessive water loss, leading to nutrient deficiencies and stalled growth. On the other hand, a low VPD (e.g., below 0.8 kPa) can result in poor transpiration, slowing nutrient transport and reducing energy available for flower formation.
Strategies for Regaining Balance During Transition
To recover from these imbalances, growers can aim to stabilize the VPD within the range of 0.8 to 1.2 kPa. Adjusting temperature and RH incrementally is key to avoiding additional stress. Adding CO2 supplementation can enhance photosynthesis and promote stronger growth during this transitional period. Additionally, ensuring adequate light intensity and nutrient availability supports a smooth transition to flowering.
Mid/Late Flowering Stages
During the middle and late flowering stages, growers must carefully manage the environment to meet the needs of the flowering plants. Even a small deviation from the ideal VPD range can lead to a reduction in flower quality or a loss of yield.
Risks in Mid/Late Flowering Stages Caused by Incorrect VPD
The mid to late flowering stages are when the plant focuses its energy on bud development. Deviations from the ideal VPD range (1.2 to 1.6 kPa) can have severe consequences. High VPD values may lead to flower dehydration, causing brittle buds and reducing resin production. This not only affects yield but also lowers cannabinoid and terpene levels, diminishing flower quality. Conversely, low VPD values can create overly humid environments, increasing the risk of mold and bud rot, especially in dense flower clusters.
Restoring Optimal Conditions for Flowering Recovery
To restore optimal conditions, growers should focus on maintaining proper airflow and reducing humidity to lower the risk of mold. This can be achieved using dehumidifiers and carefully managing irrigation schedules to avoid overwatering. Gradually adjusting environmental controls to maintain a stable VPD within the 1.2 to 1.6 kPa range ensures proper bud development and nutrient transport. Monitoring flowers closely for signs of stress, such as discoloration or slowed growth, is essential to address problems early.
By recognizing how incorrect VPD values affect different stages of cannabis growth, growers can take proactive measures to stabilize environmental conditions. Leveraging the VPD chart as a guide, along with careful observation and targeted adjustments, can help mitigate risks and ensure healthy plant development at every phase.
Leveraging Technology to Overcome VPD Chart Challenges
As cannabis cultivation evolves, growers are increasingly aware of the limitations of traditional VPD charts. While these charts provide valuable insights into the ideal temperature and humidity ranges for different growth stages, they are often static and lack the flexibility needed to adapt to real-time environmental conditions.
Fortunately, advancements in technology have made it possible to overcome many of these challenges. By embracing dynamic tools, smart integrations, and data-driven solutions, growers can optimize their VPD management with greater precision and ease.
Introducing Dynamic and Customizable VPD Charts
Dynamic VPD charts offer a significant improvement over traditional static charts by allowing growers to adapt environmental parameters to their specific cultivation setup. Unlike static charts that rely on average temperature and humidity values, dynamic charts account for variables such as regional climate. This customization ensures the VPD recommendations align with the unique needs of the grow operation.
One example of a tool offering this functionality is VPDChart.com, an online platform that lets growers create customized VPD charts based on input parameters like leaf temperature and ambient conditions. These charts can dynamically adjust to changes, helping growers maintain the ideal VPD range throughout different growth stages. By incorporating these tools, growers reduce the risks associated with incorrect VPD ranges, such as stunted growth or disease outbreaks.
Mobile Apps and Cloud Platforms for VPD Monitoring
Mobile apps and cloud-based platforms have revolutionized how growers monitor and manage VPD in real time.
A standout example in this category is the Pulse Grow system. Pulse Grow sensors continuously monitor environmental factors such as temperature, humidity, and CO2 levels while providing real-time data through an intuitive mobile app. The app not only visualizes current VPD conditions using customizable charts but also sends alerts if environmental parameters deviate from the optimal range. This proactive approach helps growers take immediate corrective action to minimize plant stress.
Moreover, Pulse Grow integrates cloud storage for historical data, allowing growers to analyze trends and adjust their strategies for better long-term results. With these capabilities, mobile apps and cloud platforms make it easier to maintain precise VPD conditions, regardless of the grower’s location or the scale of their operation.
Integration of VPD Management with Smart Climate Control Systems
Integrating VPD management into automated climate control systems provides a seamless and efficient way to achieve this. Unlike manual adjustments or static VPD charts, advanced climate control systems combine real-time monitoring and automated adjustments to ensure consistent VPD levels throughout the cultivation process.
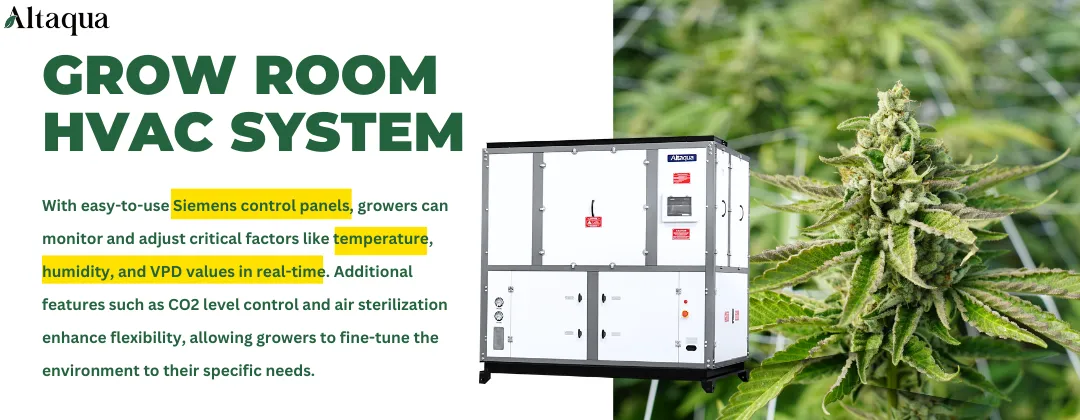
Our Altaqua Grow Room HVAC System offers a comprehensive solution for maintaining the ideal environment for cannabis cultivation. The system uses a Siemens control panel to continuously monitor temperature and humidity, adjusting both in real time to maintain the target VPD range. This simultaneous control eliminates the need for growers to manually monitor and adjust environmental parameters, significantly reducing labor and the margin for error.
Additionally, the system features WiFi connectivity, enabling growers to remotely monitor and manage their grow rooms. Using a user-friendly interface, growers can access real-time data on temperature, humidity, and VPD conditions, as well as the system’s operational status. This remote functionality ensures that growers can stay informed and make adjustments as needed, even when they are not physically present at the grow site.
By automating temperature and humidity control while providing remote access to key data, the system helps growers maintain an optimal environment for plant growth with minimal effort. This not only reduces the risks of VPD-related stress but also improves efficiency and yield quality, making it an invaluable tool for modern cannabis cultivation.
Conclusion
A vpd chart is a auxiliary tool for optimizing cannabis growth by balancing temperature, humidity, and plant transpiration. However, their effectiveness depends on accurate interpretation and proper application across different growth stages. While challenges such as environmental variability and limited integration exist, modern solutions like dynamic charts, mobile apps, and advanced climate control systems simplify VPD management. By leveraging these tools, growers can ensure healthier plants, higher yields, and more efficient operations.
FAQ
1. What is a VPD chart, and why is it important for cannabis cultivation?
A VPD (Vapor Pressure Deficit) chart is a tool used by cannabis growers to optimize the balance between temperature, humidity, and transpiration. It helps growers maintain ideal environmental conditions for different growth stages, ensuring healthy plant development and maximizing yield quality. By referencing a VPD chart, growers can prevent issues like over-transpiration, under-transpiration, and mold development.
2. How do you interpret a VPD chart for cannabis plants?
To interpret a VPD chart, focus on the X-axis (humidity), Y-axis (air temperature), and leaf temperature adjustments. Each colored zone corresponds to optimal VPD ranges for specific growth stages. For example, early vegetative stages prefer 0.4–0.8 kPa, while flowering stages thrive at 1.2–1.6 kPa. Use a hygrometer, thermometer, and infrared thermometer for accurate readings and adjust your grow room conditions accordingly.
3. What happens if the VPD is incorrect for cannabis plants?
An incorrect VPD can disrupt plant health by causing over-transpiration or under-transpiration. Low VPD may lead to poor nutrient uptake and mold, while high VPD increases stress, resulting in wilting and reduced growth. For example, during flowering, excessive transpiration might reduce flower density. Recovery strategies include adjusting humidity, temperature, or using automated climate control systems.
4. What’s the difference between static, dynamic, and customizable VPD charts?
Static VPD charts provide general temperature and humidity ranges but lack adaptability to environmental changes. Dynamic VPD charts are Real-time tools, such as VPDChart.com, that adjust to environmental variables.
Share with your friends:
Popular Blogs on Altaqua:
Download Catalogue


