VPD Chart: How Growers Actually Use It (and Why It Often Fails)
Updated: Dec. 30 ,2025 · 5 min read
Abstract: VPD charts are useful references, but they don’t control grow room conditions. This article explains why VPD can look correct while humidity problems persist—especially at night—and shows how stable temperature and independent moisture control are essential for making VPD targets actually work.
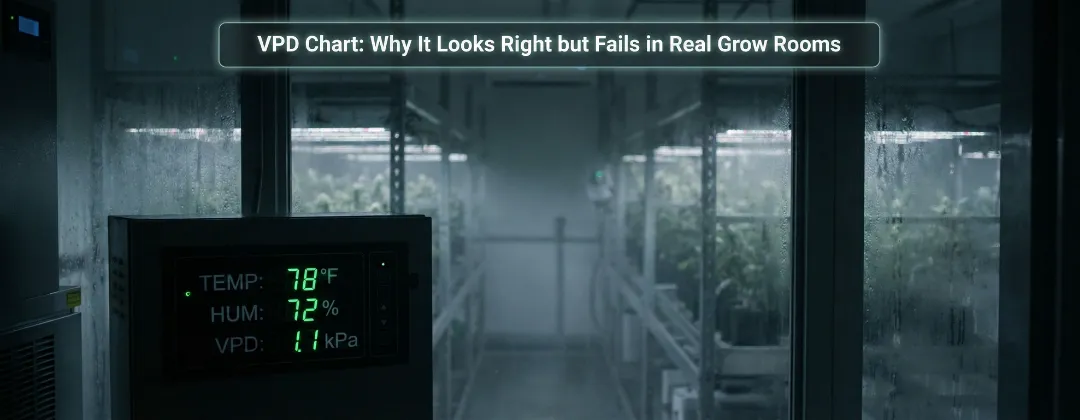
Table of Contents
show
If you grow indoors, chances are you’ve looked up a VPD chart before.
Most people do it for the same reason. Something feels off in the room. Humidity is acting weird. Leaves don’t look quite right. And sooner or later, someone says, “Check your VPD.”
So you Google it. You find a chart. Temperature on one axis, humidity on the other. Green zone looks nice and safe.
Simple enough, right?
Well… not always.
The VPD Chart Everyone Is Looking For
At its core, a VPD chart is just a reference. It shows how temperature and relative humidity combine into a vapor pressure deficit value, usually in kPa.
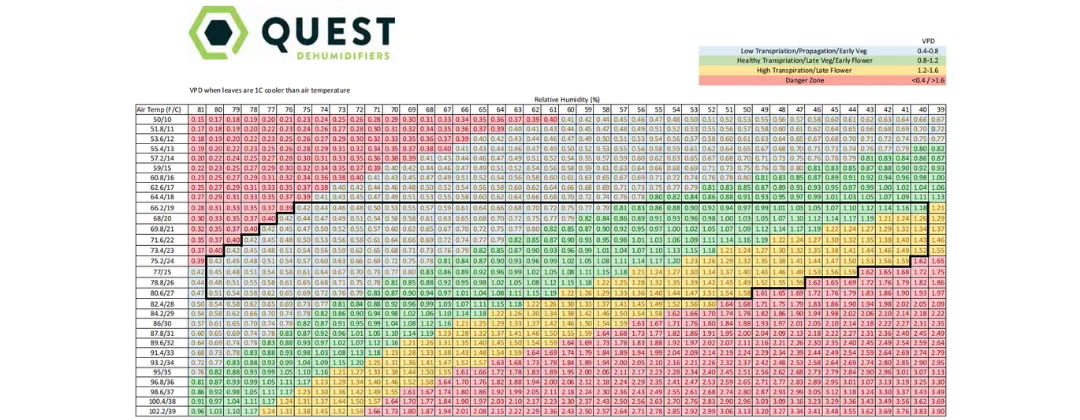
Image source: Quest Dehumidifiers
What growers want from it is very practical:
- “If my room is this warm…”
- “And my humidity is around here…”
- “Am I in a good place or not?”
And honestly, that’s fair. A clean, readable VPD chart is useful. It gives you a target. It gives you context.
The problem isn’t the chart itself.
The problem is what we expect it to do.
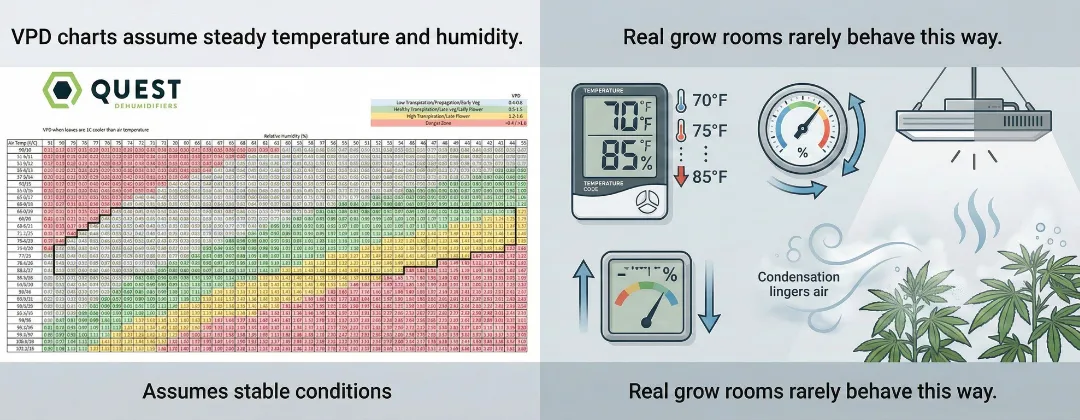
What the Chart Quietly Assumes (But Never Tells You)
Most VPD charts are built on some pretty calm assumptions.
They assume:
- Temperature isn’t swinging much
- Humidity is relatively stable
- Plants are actively transpiring
- Lights are on
- The room is behaving nicely
In other words, the chart assumes a steady environment.
If your grow room actually works like that all the time… congratulations. Most don’t.
Real rooms cycle. Loads change. Lights turn off. Air cools down. Moisture hangs around longer than you’d like.
And once those assumptions fall apart, the chart starts to lose its grip on reality.
“My VPD Is Fine” — So Why Is Humidity Still a Mess?
This is where a lot of growers get frustrated.
They look at the numbers and think:
- Temperature: okay
- Humidity: not terrible
- VPD: right in the green
But then:
- Night comes
- Temperature drops
- RH shoots up
- Alarms go off
- Condensation shows up where it shouldn’t
At that point, the chart feels useless.
The key thing to understand is this:
VPD is not something you control directly. It’s something that happens as a result.
If temperature drops faster than moisture is removed, humidity rises. Even if the VPD number still looks acceptable on paper.
The chart describes balance. It doesn’t enforce it.
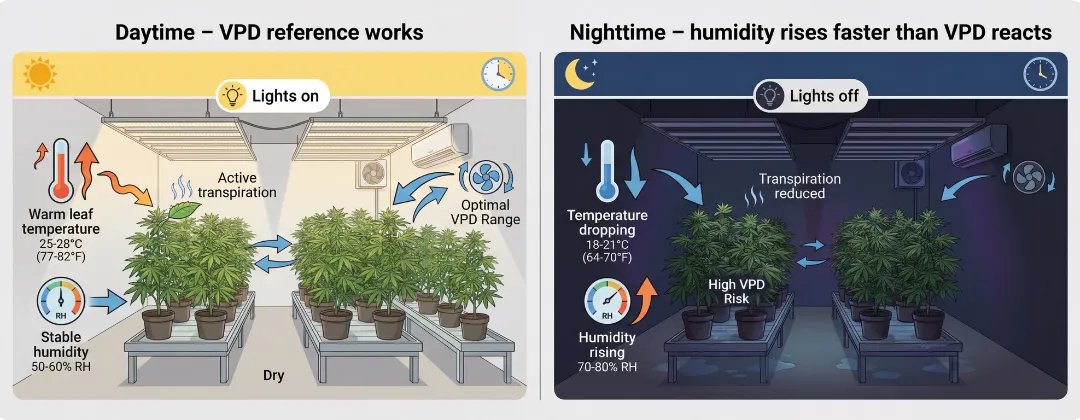
Why Daytime VPD Logic Breaks Down at Night
Another common mistake is treating VPD as a 24/7 rule.
During the day:
- Leaves are warm
- Transpiration is active
- Lights help stabilize temperature
- Systems have an easier time keeping things steady
At night, everything changes:
- Leaf temperature drops
- Transpiration slows way down
- Moisture removal becomes harder
- Humidity reacts fast — sometimes too fast
Trying to hold the exact same VPD target day and night often turns into a losing game. You’re chasing numbers instead of controlling conditions.
That’s why so many “VPD problems” show up after lights-off.
What a VPD Chart Simply Can’t Do
A VPD chart is a reference tool. Nothing more.
It can’t:
- Pull moisture out of the air
- Keep humidity down when temperature drops
- Stop nighttime rebound
- Separate latent load from sensible cooling
If a room can’t manage heat and moisture independently, no chart is going to save it.
That’s not a VPD issue. That’s a system issue.
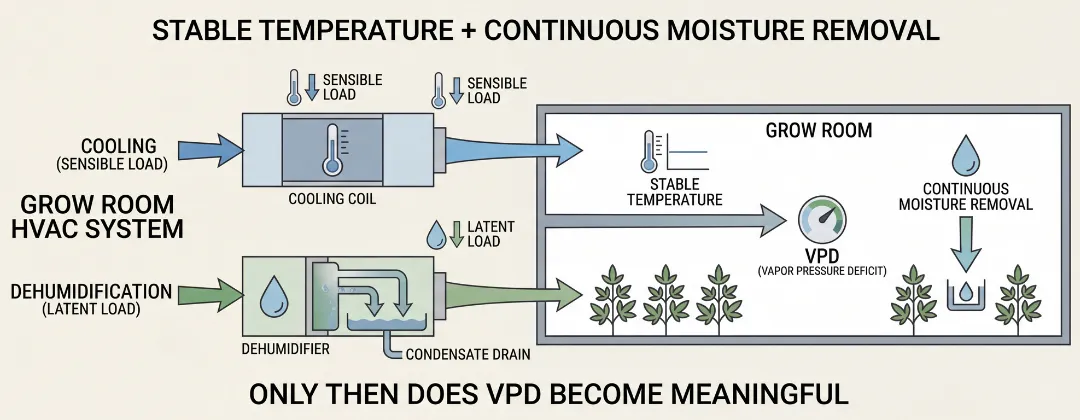
Where HVAC Design Actually Comes In
This is the part most charts never talk about.
In many grow rooms, cooling and dehumidification are tied together. When temperature hits setpoint, cooling stops. And when cooling stops, moisture removal stops too.
But plants don’t stop releasing moisture just because the thermostat is happy.
Without reheat or dedicated latent capacity, systems are forced into bad choices:
- Overcool the room to chase humidity
- Or let humidity climb to protect temperature
Neither option creates a stable environment. And without stability, VPD numbers don’t mean much.
When HVAC systems are designed specifically for grow rooms — with proper latent control — things change. Temperature can stay where it needs to be while moisture is still being removed.
That’s when VPD starts behaving like the charts say it should.
How to Use a VPD Chart Without Fighting Your Room
The most practical way to think about a VPD chart is this:
- First, make sure your system can actually hold temperature and humidity steady
- Then, use the chart as a fine-tuning reference
- Don’t treat it like a controller or a rulebook
When the environment is stable, VPD becomes useful. When it isn’t, the chart just highlights problems you can’t fix at the chart level.
One Last Thought
VPD charts aren’t wrong. They’re just incomplete.
If your grow room struggles at night, or humidity keeps creeping up even when the numbers look “right,” you’re probably not misreading the chart.
More often than not, the room simply can’t do what the chart assumes it can.
Fix the environment first.
Then let the VPD chart do what it was meant to do: help you fine-tune, not fight physics.
FAQ
1、Why does my VPD look correct while humidity keeps rising at night?
Because VPD is a calculated result, not a direct control setting. When lights turn off, temperature often drops faster than moisture can be removed from the air. Even if the VPD number stays in the “optimal” range on a chart, relative humidity can still climb quickly. This is a system limitation, not a problem with how you’re reading the chart.
2、Can I use the same VPD chart for both daytime and nighttime conditions?
Not reliably. Most VPD charts assume daytime conditions with active transpiration and stable temperatures. At night, leaf temperature drops, transpiration slows, and moisture becomes harder to control. Using the same VPD targets around the clock often leads to humidity rebound after lights-off.
3、Will following a VPD chart fix humidity problems in my grow room?
Only if your grow room can already hold temperature and humidity independently. A VPD chart can help fine-tune conditions, but it can’t remove moisture, prevent nighttime humidity spikes, or compensate for system design limits. If humidity control is unstable, the issue is with environmental control—not the chart.


Share with your friends:
Popular Blogs on Altaqua:


Download Catalogue